We are currently updating our site; thank you for your patience.
Projects
Projects - Progress Chart
| Ribbon Access: Maintenance / Projects > Projects |
- The Project Listing screen will be displayed.
- Select the Site where the project can be located.
- The example has Durban selected.
- Ensure that the Status has been set to Open.
Ideally a project is closed when all the work on the project has been completed. You will therefore not need to generate a progress chart on a Closed project as it will show all the work as Completed.
- Click on the row of the project you wish to generate the progress chart for.
- Click on the Progress Chart tile.

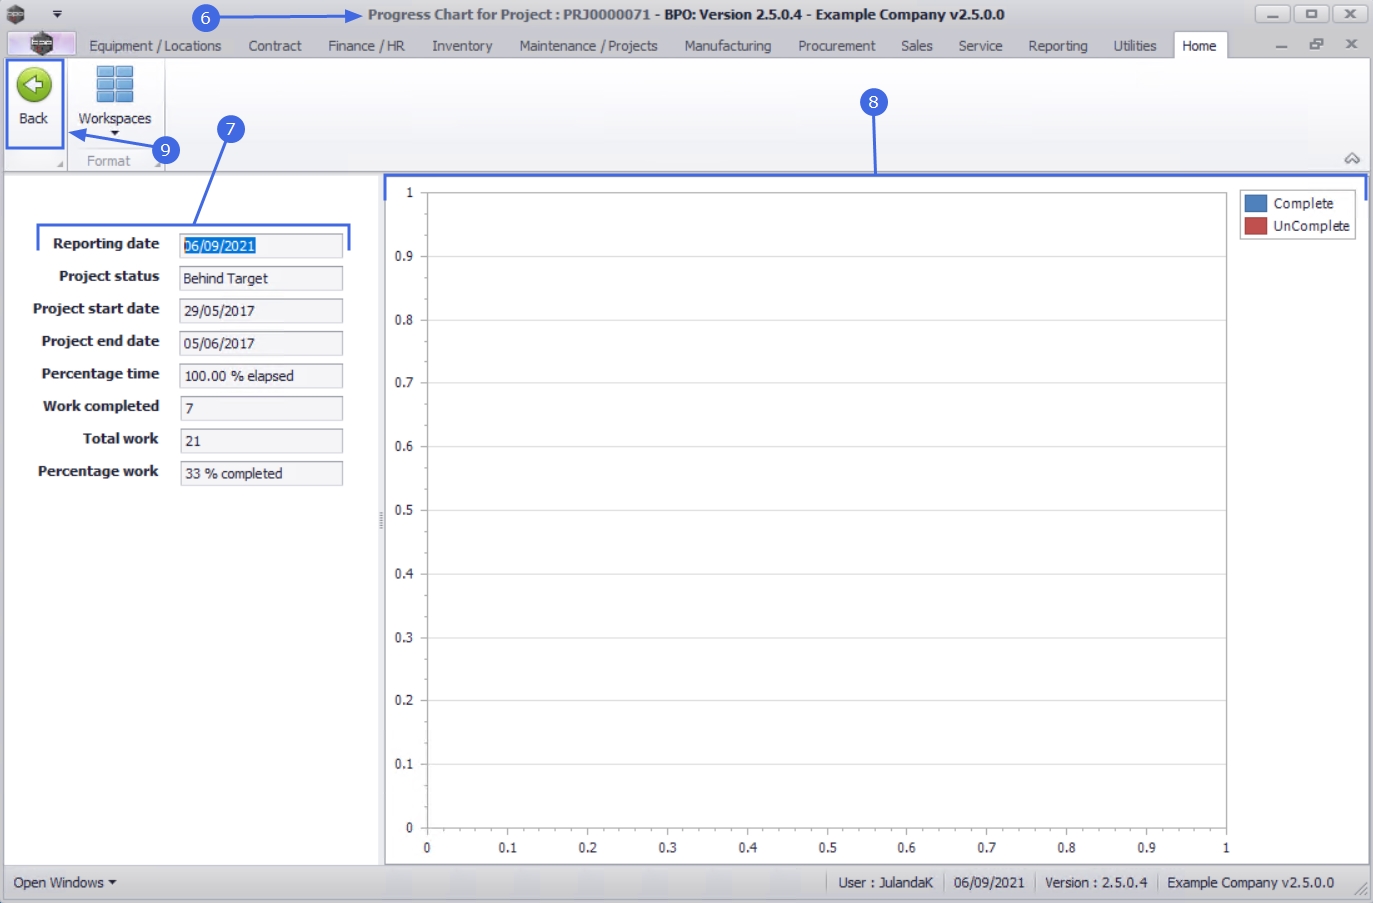
- The Progress Chart for Project : [project ref number] screen will be displayed.
![]() The information on this screen cannot be edited.
The information on this screen cannot be edited.
- The Chart Information Panel.
- Reporting date: This will be the current date that the progress chart for the project was generated.
- Report status: This field will give you an indication whether the project is Behind Target or Ahead of Target.
- Project start date: This date is the date that the project is scheduled to start.
- Project end date: This is the date the project is projected to be completed. This date will also include any Baseline Adjustments for the selected project.
- Percentage time: This field will provide information on the percentage of time lapsed on the project.
- Work completed: This field will list the number of tasks that have been completed for the project.
- Total work: This field will list the total number of tasks that have been created for the project.
- Percentage work: This field will display the percentage of work that has been completed on the project.
- The Chart frame will plot the chart information in a stacked Column View where you can tract the work that have been Completed and work that reflect as UnComplete.
- Click on Back to return to the Project Listing screen.
MNU.058.055