BPO Insight
CEO Dashboard
Introduction
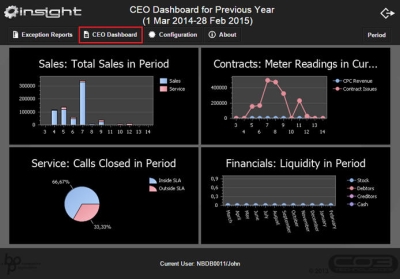
This dashboard shows 4 graphs related to high level details often required by managers.
| Ribbon Access: BPO Insight> Configuration |
- Click on the 'CEO Dashboard' link.
- Give the screen a moment to calculate the charts.
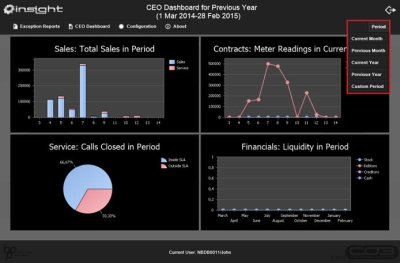
- Click on the 'Period' button and select the
option to want to view, from:
- Current Month
- Previous Month
- Current Year
- Previous Year
- Custom Period
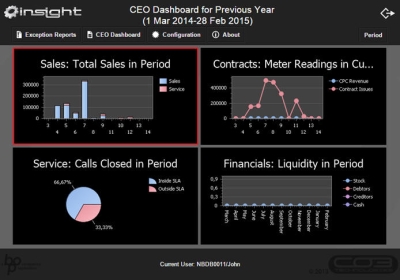
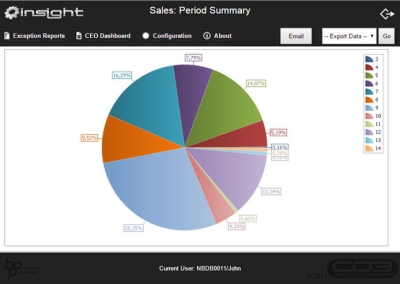
- To pull a more specific chart / view the report data - click on the report you want to view.
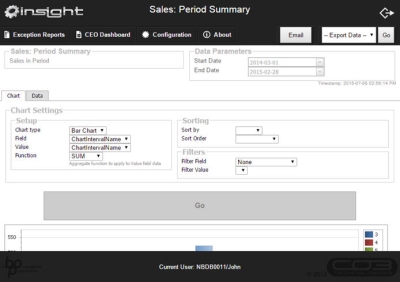
- The Report will open, showing you the date range from the period selected above.
- The 'Chart' tab is selected by default.
- You can update the Chart Setup, Sorting and Filters - then click on 'Go'
- The chart will populate based on your selection.
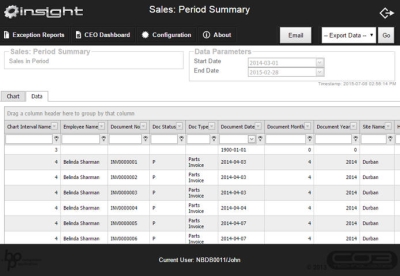
- Click on the 'Data' tab to view the report data
- View / group / filter as required.
- You can email or export the report in the same way as the exception reports.
MNU.157.005
