We are currently updating our site; thank you for your patience.
Reporting
All Reports - Export and Pivot Chart
Introduction
In BPO, you can export a report to Excel or PDF as well as create a report pivot chart.
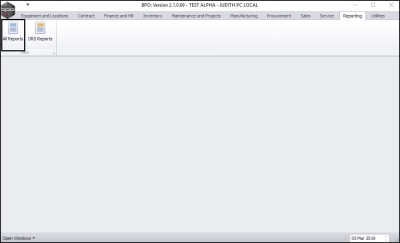
Ribbon Select Reporting > All Reports
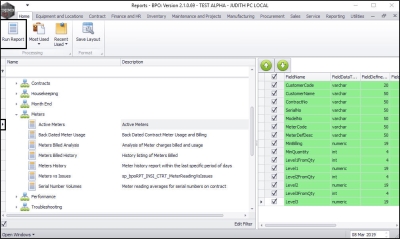
The Reports screen will be displayed.
Select and Run Report
- Browse or search for the report you want to view.
- In this image, Active Meters has been selected.
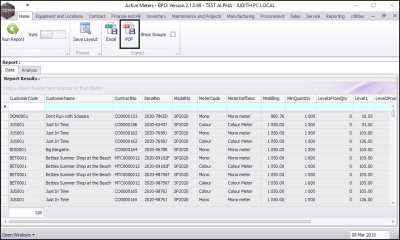
- Click on Run Report.
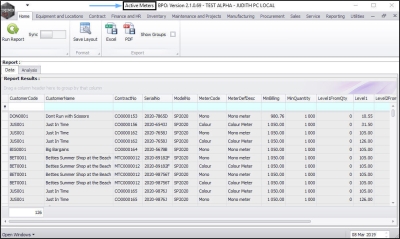
- The report screen specific to the selected report will be displayed.
- In this image, the Active Meters screen has been displayed.
Export Report to Excel
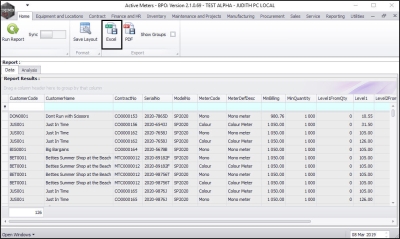
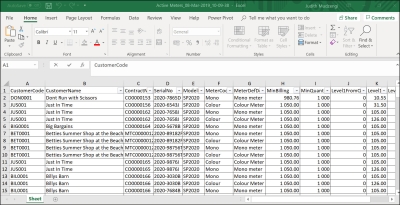
- Click on Excel.
- This will open MS Excel with a new spreadsheet and load all the data from the data grid into that spreadsheet.
- You can then save, view, search for data, prepare it for printing, etc. as required.
Export Report to PDF
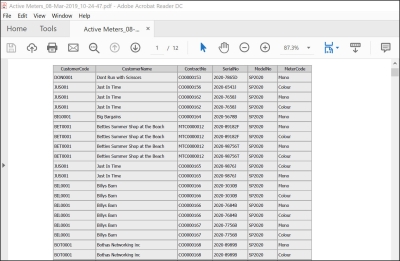
- Click on PDF
- The data from the data grid will be displayed in the PDF Reader.
- You can then save, view, print the data etc. as required.
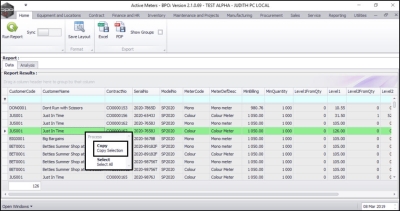
Selecting and Copying Data
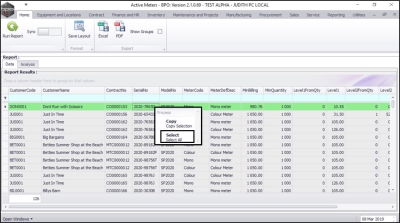
To select all data in the data grid:
-
Either,
- Right click and click on Select All from the pop up Process menu.
-
Or,
- Press Ctrl + A on the keyboard.
-
To copy selected data in the data grid,
-
Either,
- Right click and then click on Copy Selection from the pop up Process menu.
-
or,
- Press Ctrl + C on the keyboard.
Create Pivot Chart
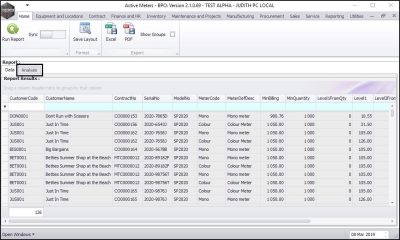
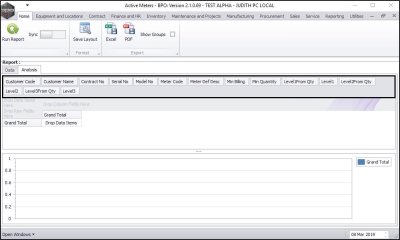
- Click on the Analysis tab.
- The available report column headers will be displayed just below the Analysis tab.
- Decide which information (headers) you wish to use for the pivot chart.
Selecting Columns for the Pivot Chart
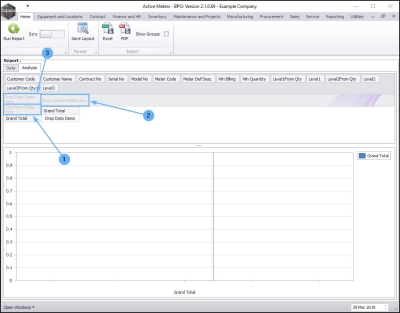
The columns you wish to select for the Pivot Chart must be dragged and dropped into the relevant areas:
- Rows: Drop selected column header(s) in the Drop Row Fields Here area.
- Columns: Drop selected column header(s) in the Drop Column Fields Here area.
- Data Items: Drop selected column header(s) in the Drop Data Items Here area.
- Note 1:
It is
not
mandatory to drop columns in all 3 fields, for example you can drop columns in
Row
field and
Data
field but leave out the Column
field.
Note : You can drop multiple columns in a field for example, you can drop Serial No and Model No columns in the Row field.
-
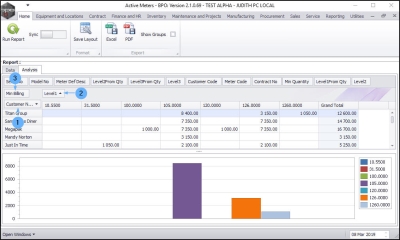
In this example,
- Customer Name has been dropped in the Row field,
- Level 1 has been dropped in the Column field and
- Min Billing has been dropped in the Data field.
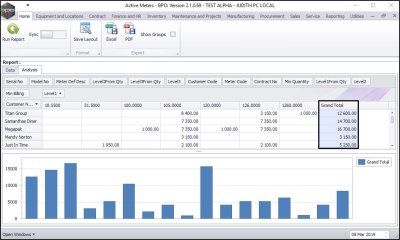
- You can pull a report per column by clicking on the column of your choice.
- In this image, Grand Total column has been selected and the report displayed is specific to the data in that column.
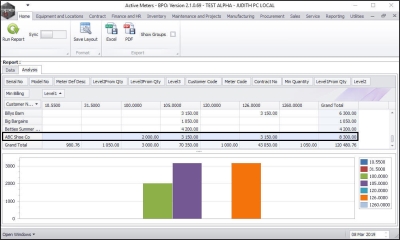
- You can also pull a report per row by clicking on the row of your choice.
- In this image, ABC Show Co row has been selected and the report displayed is specific to the data in that row.
Note: You also export the pivot charts to Excel or to PDF.
Related Topics
|
||||||
| Status: ....... | ||||
| MNU.149.004 | Software Version: ....... | |||
| 02 July, 2024 | Date: ....... |
MNU.149.004
