We are currently updating our site; thank you for your patience.
Reporting
All Reports - Customise Reports
A user can customise a report to suit preference and several methods can be used to achieve this as set out below.
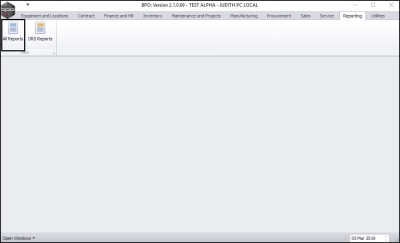
Ribbon Select Reporting > All Reports
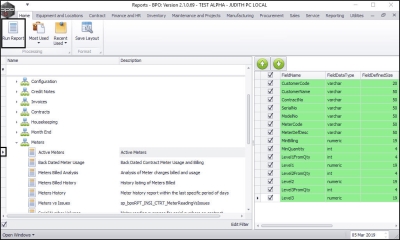
The Reports screen will be displayed.
Select Report
- Browse or search for the report you wish to view.
- Click on Run Report.
- In this image, Active Meters has been selected.
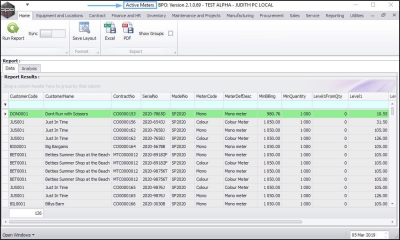
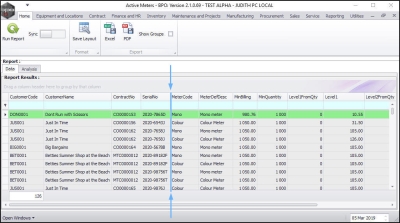
- The report screen specific to the selected report will be displayed.
- In this example, the Active Meters screen has been displayed.
Removing/Adding Columns
There are 2 methods of removing columns:
-
Method 1:
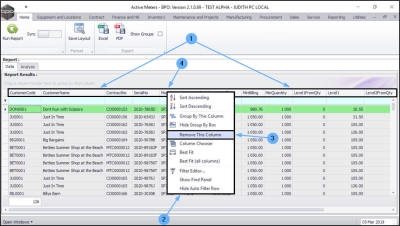
- Right click in any column header.
- The drop-down menu will be displayed.
- Click on Remove This Column option.
- In this example, the Model No column has been selected (it is positioned between the Serial No and Meter Code columns).
- The selected column, in this example Model No will now be removed.
-
Method 2:
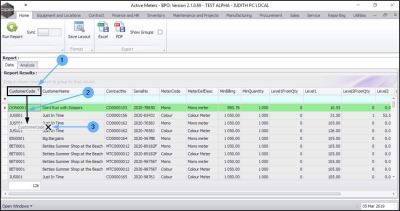
- Click on the selected column header.
- In this example, the Customer Code column has been selected.
- Drag the column header downwards away from the column header row.
- A black cross [ X ] will appear.
-
Now
drop
the column header.
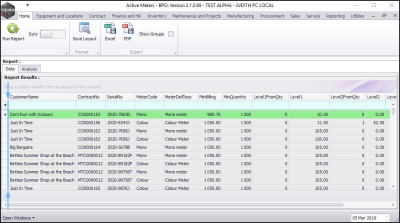
- The selected column, in this example, Customer Code will now be removed.
Recovering/Adding Columns
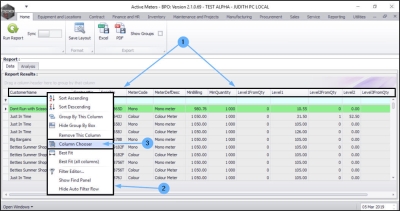
- Right click in any column header.
- The drop-down menu will be displayed.
- Click on Column Chooser.
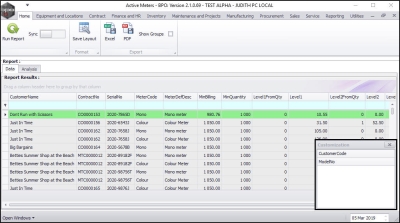
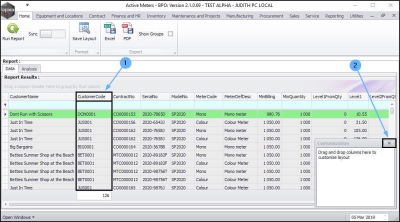
Customization Menu
- A Customization pop up menu will appear in the bottom right hand side of the screen.
- This contains an alphabetical list of all the columns that you can add to your current data grid.
Note: If all the columns are already added to your data grid, then there will be nothing listed here.
-
Either,
-
Method 1:
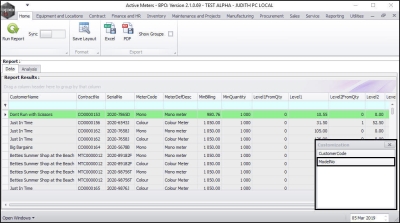
- In the Customization menu, double click on the column header that you wish to add to your data grid.
- In this image, Model No is selected.
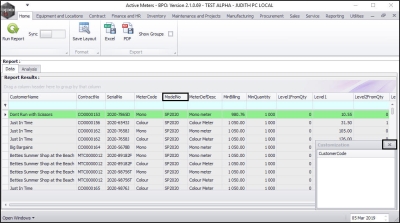
- The selected column, in this example, Model No will now be displayed in the data grid.
- Close the Customization menu when you are done.
-
Or,
-
Method 2:
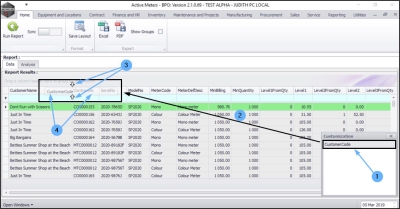
- In the Customization menu, click on the column header that you wish to add to the data grid.
- In this example, Customer Code has been selected.
- Drag the column to the column header row.
- You can drop this header anywhere in the column header row, in between any columns or at the beginning or end of the column header row according to your preference. 2 white arrows will appear to show you where the column will be added. Keep dragging the selected column along this header row until the arrows point to the required place.
- In this example, the arrows are indicating that the selected Customer Code column will be dropped between the Customer Name and Contract No columns.
- The selected column, Customer Code will now be displayed in the data grid.
- Close the Customization menu when you are done.
Additional Data Grid Information
For more information on the editing and organisation of data grids, navigate to the following manuals:
Save Layout
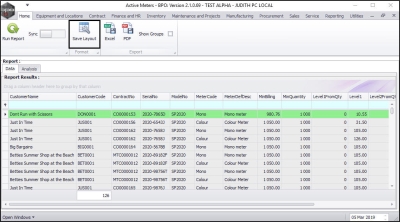
- If you wish to keep the changes made to the data grid, you must click on Save Layout.
- If you do not use this functionality, the changes will be undone as soon as you close the screen.
- These changes are saved per user.
- Close the screen when you are done.
Group Data by Column
-
Method 1:
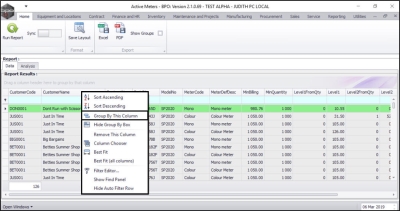
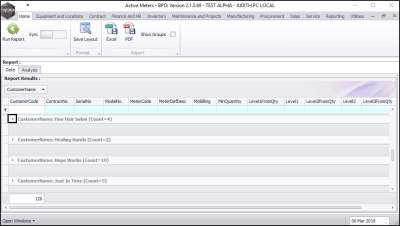
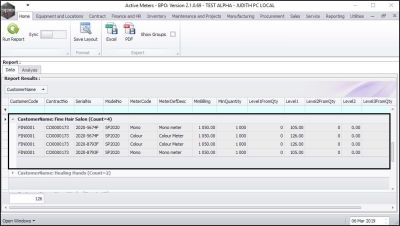
- In the column header of your choice, right click to display the drop-down menu, then click on the Group By This Column option.
- In this example, items will be grouped by Customer Name.
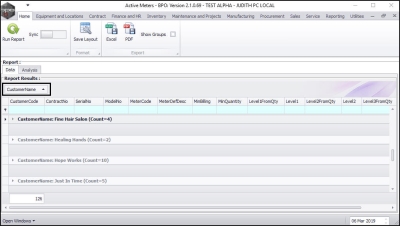
- The data grid will now display the results of your Group By This Column choice.
- The Group By box above the column will now display which column has been sorted.
-
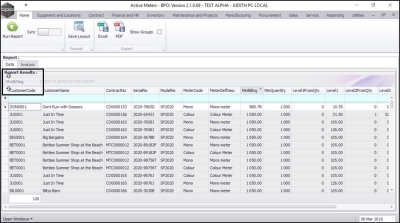
Method 2:
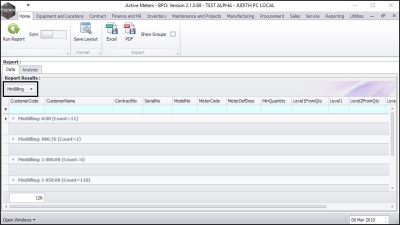
- Click and hold on the column header of your choice.
- In this example, Min Billing has been selected.
- Drag the selected header up and away from the original column header position.
- As you do this, two white arrows will appear directing you to the Group By box.
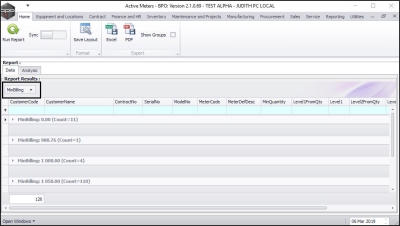
- Drop the column header in this box.
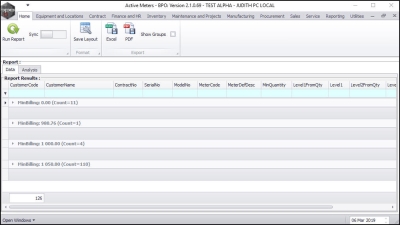
- The data grid will now display the results of your column sort.
- The Group By box above the columns will now display which column has been sorted.
- in this example, Min Billing.
Create a Sub Group
You can also create a sub-group.
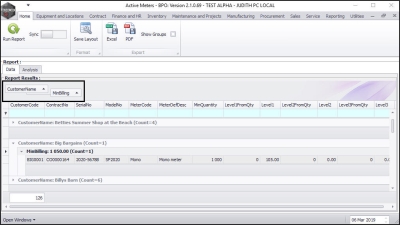
- In this example, first the Customer Name column was grouped, using Method 2 then the Min Billing columns was sub-grouped, also using Method 2.
- To view the details for any grouping, click on the arrow in the selected row.
- You can now view the details of the grouping.
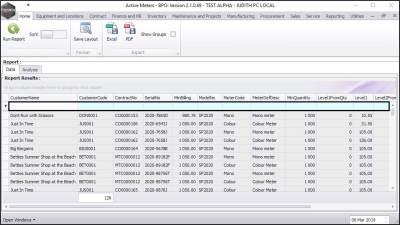
Hide 'Group By' Box
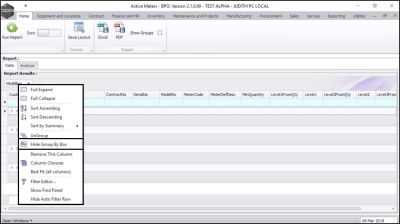
- Right click in any column header to display the drop-down menu, then click on the Hide Group By Box option.
- The Group By box which is usually above the column header row is now hidden.
Un-hide 'Group By' Box
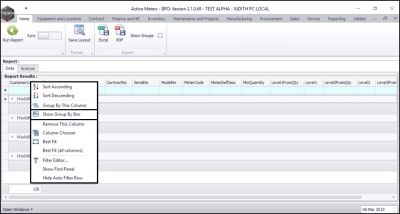
- Right click in any column header to display the drop-down menu. Then click on the Show Group By Box option to display the Group By box again.
- You can now view the Group By box.
Ungroup Data
-
Either,
- Right click on the Group By box to display the drop-down menu.
- Click on Ungroup.
-
Or,
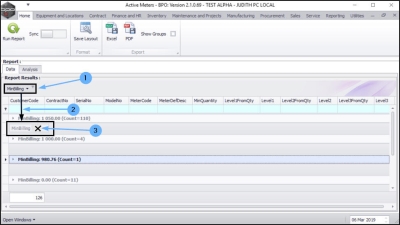
- Click on the selected column header in the Group By box.
- In this image, Min Billing is selected.
- Drag this header downwards until,
- a black [ X ] appears then Drop the box.
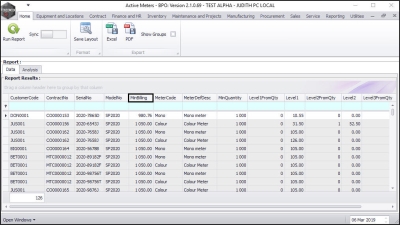
- The data grid will now be displayed without the grouping option.
Note: If you cannot find the column you removed from the Group By box, then add the column to the data grid.
Filtering Columns
The Filter Search Row
The Filter Search Row can be used to filter the data in the open screen.
- This row will display any choices of column filtering that you have made in that screen.
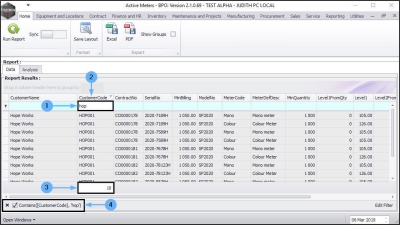
- You can type directly in this row to filter your columns.
- In this example, hop has been typed in the Filter Search row of the Customer Code column.
- The Customer Code column now displays all the results of this filter i.e. all the rows containing the word hop in that column.
- The total number of results is displayed at the bottom of the column.
- All filters can be viewed at the bottom of the screen.
Filter Multiple Columns
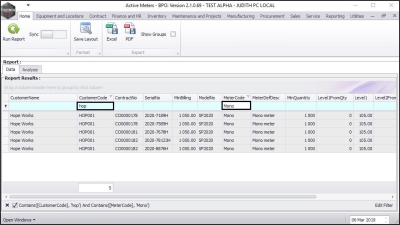
You can also filter more than one column.
- In this image, the data is filtered by Customer Code and Meter Code.
The Column Header Filter Icon
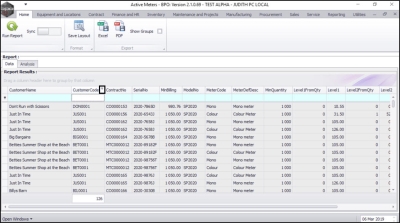
- You can also filter in columns by hovering over the column header cell.
- The column header cell will highlight white.
- A Filter icon will appear in the top right of the column header cell.
- Click on this Filter icon.
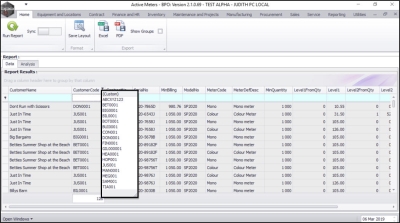
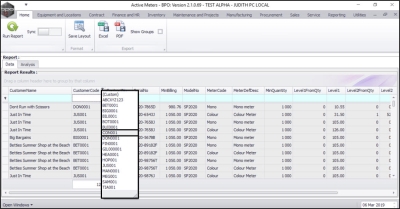
- A quick reference drop-down Filter menu will be displayed.
- This menu lists in numerical / alphabetical order the contents of the selected column.
- Click on your choice of filter in this menu.
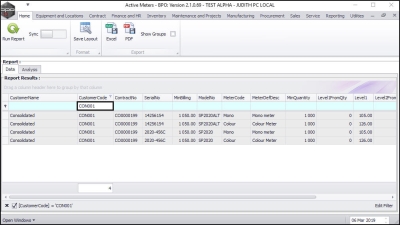
- In this image, filter CON001 has been selected.
- The data grid will now display the results of that filter.
The Custom Filter
Follow a similar process to select the Custom Filter.
- Hover over the selected column header cell.
- The column header cell will highlight white.
- A filter icon will appear in the top right of the column header cell.
- Click on this filter icon.
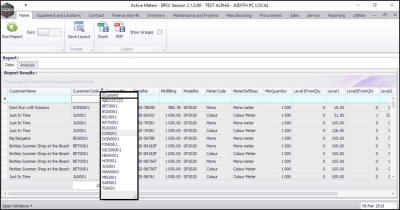
- A quick reference drop-down filter menu will be displayed.
- This drop-down filter menu lists in numerical / alphabetical order the contents of the selected column.
- Select Custom.
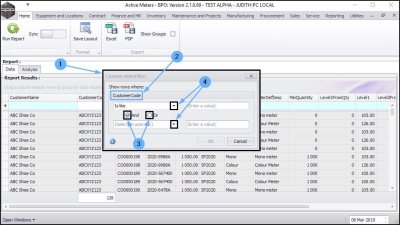
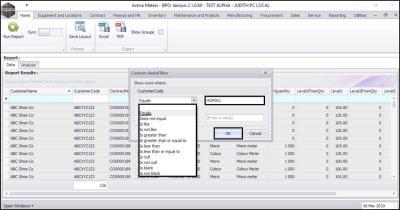
- The Custom AutoFilter screen will be displayed.
- You will note that this screen will display information that corresponds with the column selected - in this example; Customer Code.
There are a multitude of filter options:
- You can use the radio buttons and
- the drop-down arrows to select the custom filter you wish to use.
- Type in the value relating to the custom filter.
- In this image, the filter option Equals has been selected and filter value HOP001 has been typed in.
- Click on Ok.
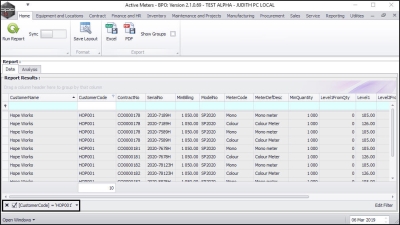
- The report will now be filtered according to the selected filter.
- In this image, only rows with Customer Code equal to HOP001 are now displayed as shown in the Edit Filter row.
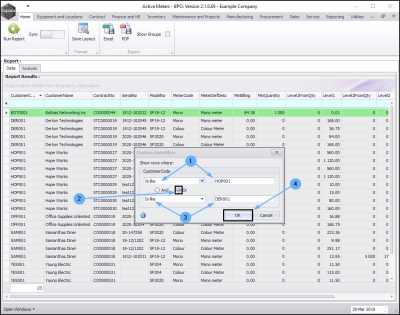
You have the option to use a second filter, if required.
- In this image, the first filter Is like HOP001.
- The Or radio button filter has been selected.
- The second filter is Is like DER0001.
- Click on Ok.
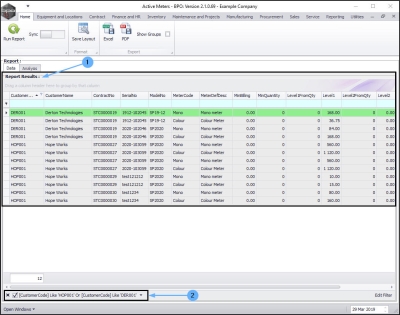
- The Report Results data grid will now be filtered according to the selections made.
- The Edit Filter row will display the selected filters for reference.
MNU.149.003
